
How to read any MAMAY screener
Short version for experts: tables, lists and screenshots only.
Words in this lesson (11)
Two different questions
When you look at a stock or a coin, you're really asking two things:
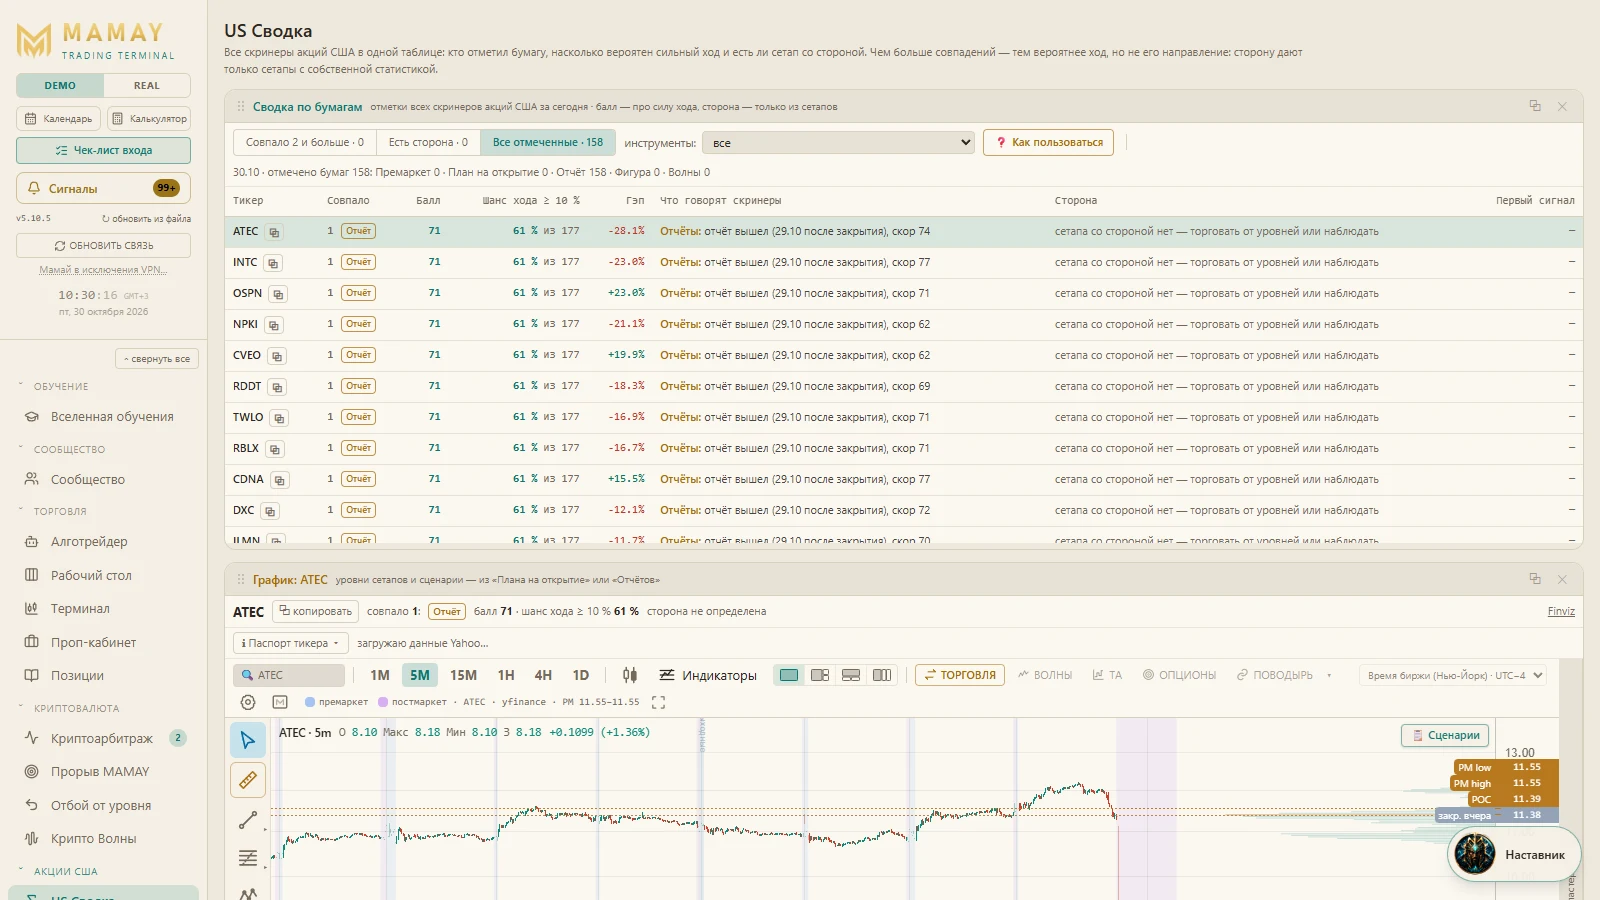
- Will there be a strong move?
- In which direction?
Beginners think it's one question. MAMAY answers them separately — and that's the main thing to understand about all of its screeners.
The score answers only the first question
Almost every screener has a "Score" column from 0 to 100. It says: how likely it is that the price will move noticeably today.
An example from a test on US stock history (1,982 stocks):
| What was there in the morning | Share of stocks that moved 10% or more that day |
|---|---|
| no gap and no high score | 9% |
| high premarket score (60+) | 27% |
| a gap of 5% or more | 61% |
| both a gap and a high score | 79% |
The score works: the more signs line up, the more often a strong move happens.
Now the second number. Among the stocks where everything lined up, only 31% closed above the signal price. In other words, "everything lines up — I'm buying" lost more often than it won.
Setups give the direction
A setup is a specific rule: "if this happened — we enter there, the stop is here, the target is there". Every setup in MAMAY has its own statistics: how many times it occurred, what share of trades were profitable, how much it brought on average after fees.
The "Side" column shows long or short only when such a setup has triggered. If there's no setup, the column is empty — and that's an honest answer: "a move is likely, the direction is unknown".
How to use this
- High score + a side — a workable idea. Open the chart and look at the entry, stop and target levels.
- High score, no side — trade from levels (breakout or bounce) with a small size, or just watch.
- Low score — skip it.
Where the statistics come from
MAMAY records every signal in a journal by itself and later checks how it ended. That's what the "Signal performance" lesson is about.