
Analyze money, not drawings
Short version for experts: tables, lists and screenshots only.
Words in this lesson (16)
The main idea
Price isn't moved by lines on a chart but by money: someone buys, someone sells, someone gets closed out by the exchange. Lines and patterns are the trace money has already left behind. It's more useful to look at the money itself.
The futures market has five metrics for this. They're public — exchanges publish them for everyone.
| Metric | What question it answers |
|---|---|
| Open interest | is money coming into the market or leaving? |
| Delta | who is more aggressive right now — buyers or sellers? |
| Liquidations | who just got wiped out? |
| Funding | which side has the crowd piled into? |
| Walls | where are the large orders sitting? |
No single metric decides anything on its own. The meaning appears when you read them together with the price.
1. Open interest
Open interest (OI) is how many futures positions are currently open. Each position is one long and one short facing each other.
- OI rises — new positions are opening, money is coming into the market.
- OI falls — positions are closing, money is leaving.
The main table of the lesson:
| Price | OI | What's happening | How to treat it |
|---|---|---|---|
| up | up | new buyers are coming in | the rise is real, money is behind it |
| up | down | shorts are closing | a rise on other people's stops — the fuel will run out soon |
| down | up | new sellers are coming in | the fall is real |
| down | down | longs are giving up and leaving | the sell-off is running out of steam |
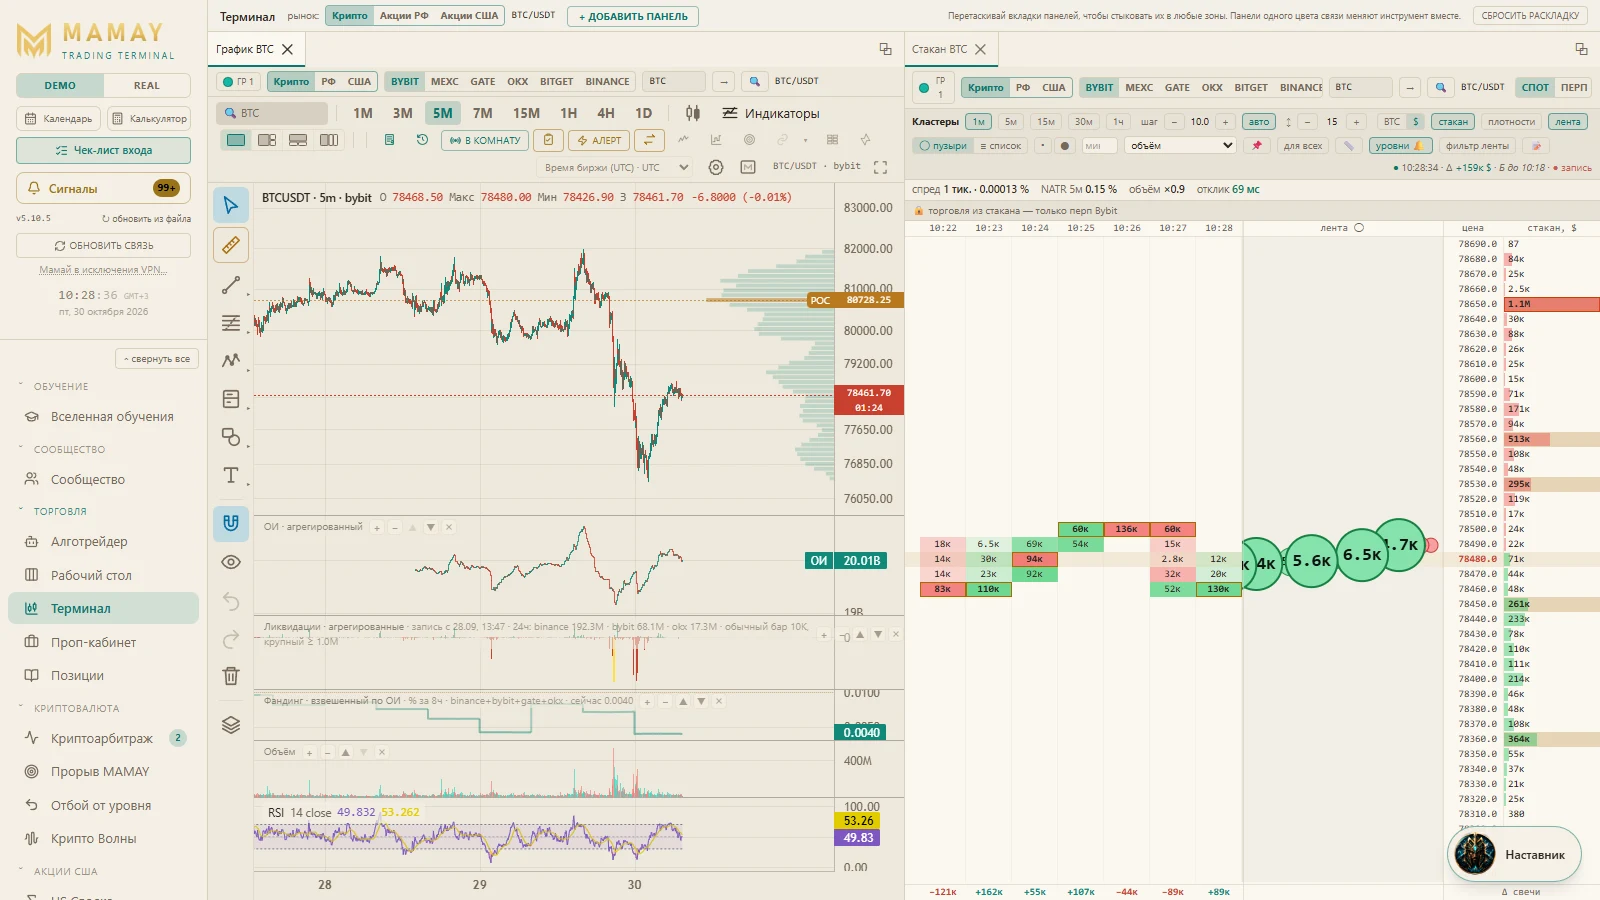
In MAMAY: the "OI" button on the chart in "Terminal" — the "OI · aggregated" panel (the total across exchanges).
2. Delta
Someone always initiates a trade: either a buyer takes "at market" or a seller gives "at market". Delta is the difference between such buys and sells.
- Positive delta — buyers are more aggressive.
- Negative delta — sellers are more aggressive.
The most interesting thing is a divergence between delta and price:
- delta is strongly positive but the price isn't rising — someone big is calmly selling to everyone who wants to buy with limit orders. The buyers are wasting their strength;
- delta is negative but the price isn't falling — someone big is just as calmly buying it all up.
In MAMAY the trade flow is visible in the "Order book" panel: footprint and tape modes.
3. Liquidations
A liquidation is the exchange force-closing a leveraged position. Closing a long is a sale, closing a short is a purchase. So liquidations move the price themselves and set off a chain: the price fell → longs got liquidated → their sales pushed the price lower → the next ones got liquidated.
How to read them:
- a spike of long liquidations on a fall — weak buyers have been wiped out. There's nobody left to sell — often this is the end of the move, not the beginning;
- a spike of short liquidations on a rise — the same, mirrored.
In MAMAY: the "Liquidations · aggregated" panel below the chart and the "Liq. zones" layer — an estimate of the prices where future liquidations have piled up. The price often heads toward such zones: other people's stops sit there.
4. Funding
Funding shows the crowd's lean.
- High positive — everyone is long and paying for it. The market is overheated to the upside.
- Strongly negative — everyone is short.
The crowd can be right for a long time, so funding is not an entry signal. It's a warning: when everyone stands on one side, a small push the other way is enough to start liquidations.
In MAMAY: the "Funding" panel below the chart, weighted by the exchanges' open interest.
5. Walls
A wall is a very large limit order at one price.
- A real wall holds and takes the hit: the price runs into it.
- A fake one disappears when the price approaches: it was placed to scare or to nudge.
In MAMAY: the "Walls" layer — an order book heatmap on the chart. The "MAMAY Breakout" screener separately marks walls as real or fake.
Reading them together: three pictures
Picture 1. A healthy rise. The price rises, OI rises, delta is positive, funding is moderate. New buyers are coming in and paying a little for it. We look for an entry on a pullback.
Picture 2. A rise on its last breath. The price rises, OI falls, short liquidations are happening, funding is high. The rise rests on other people's shorts being closed. Too late to buy.
Picture 3. A trap. The price sits below a level, OI is rising fast, funding is turning positive. The crowd is loading up on longs, expecting a breakout. Above the price — a wall, below the price — a zone of long liquidations. The vulnerable side is the buyers: if there's no breakout, they'll be carried down.
The question we ask every time
The answer matters more than any pattern on the chart. MAMAY's levels, waves and scenarios come after that — to pick the exact entry price, stop and target.
What this approach doesn't replace
Risk per trade, the stop and position size. Reading correctly where the money will go and then losing the account to leverage is a common story.