
Market phases: first understand where we are
Short version for experts: tables, lists and screenshots only.
Words in this lesson (6)
The market owes nobody anything
The most common beginner mistake is looking for an "entry point" without understanding what's happening in the market as a whole. The same picture on a chart is a buy in a rising market and a trap in a falling one.
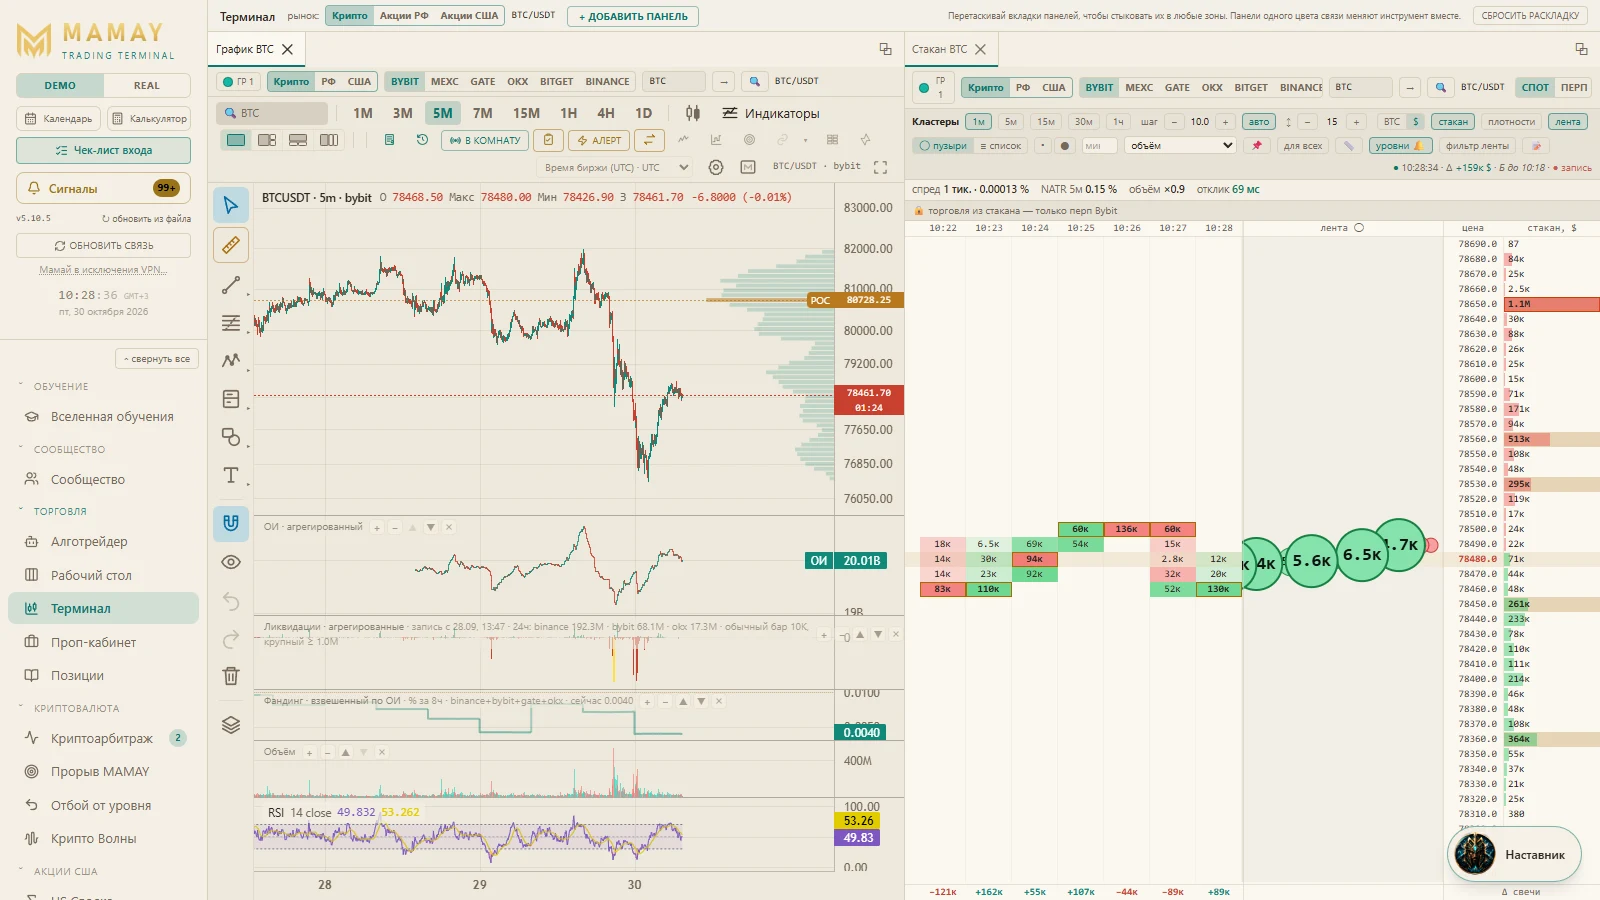
So the order is always the same: phase → levels → entry.
Four phases
| Phase | What it looks like | What the crowd does | What we do |
|---|---|---|---|
| Accumulation | a long sideways range at the bottom after a fall, low volumes | doesn't believe, doesn't watch | watch, mark the boundaries |
| Rise | every new high and low is above the previous one | comes in more and more boldly | buy the pullbacks |
| Distribution | a sideways range at the top, sharp moves back and forth | buys "at the highs" | take profits, don't buy |
| Decline | highs and lows keep getting lower | hopes and averages down | sell the bounces or stay aside |
The rule that saves the most money
- In a rising market, buy the pullbacks and sell when the highs are renewed.
- In a falling market, sell the bounces.
The crowd does the opposite: it buys when the price has already flown away and it's "scary to miss out", and sells at the bottom when it's "scary to lose everything". Those who got in earlier sell to exactly these buyers.
How to tell the phase
- Open a higher timeframe — daily or 4 hours.
- Find the last two notable highs and two lows.
- Both rising — a rise. Both falling — a decline. Standing still — a range (at the bottom — accumulation, at the top — distribution).
Lower timeframes (15 minutes, 5 minutes) are only for picking an entry point in the direction of the higher one.
Who is trapped
A useful question for any chart: who is in a loss right now, and where are their stops?
- The price broke a level upward and came back — those who bought the breakout are trapped. Their stops are below the level, and when the price gets there, their sales will speed up the fall.
- The price dropped sharply and bounced — those who sold at the bottom are trapped.
Strong moves often begin precisely with the crowd getting stopped out.