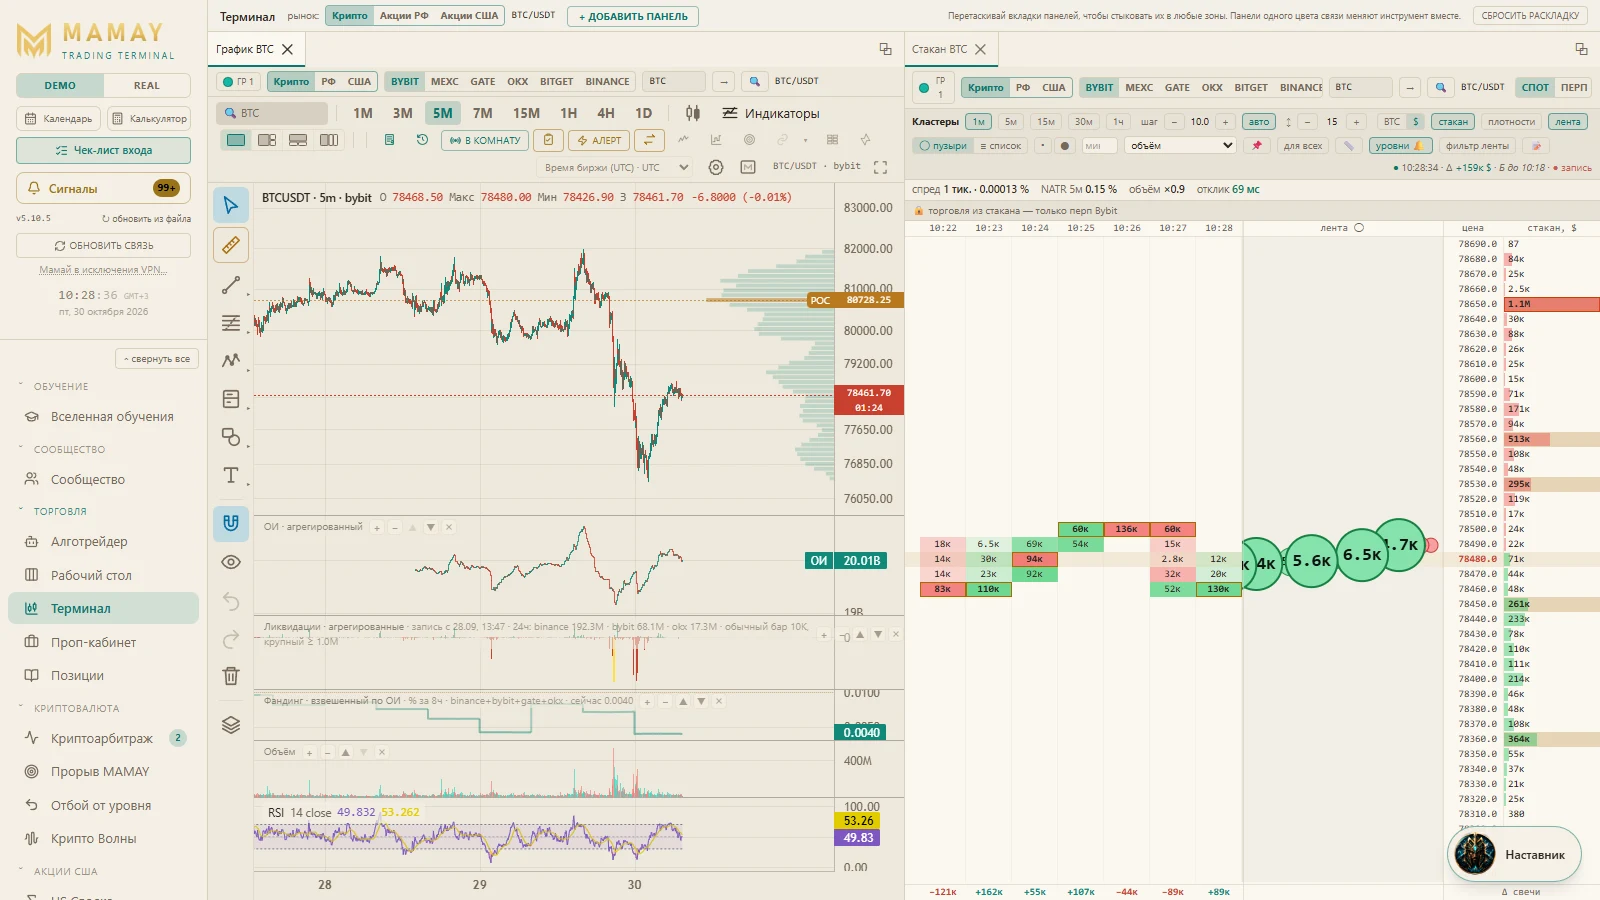
How to read a chart: candles and time
Short version for experts: tables, lists and screenshots only.
Words in this lesson (5)
A chart is the history of the price
Time runs horizontally, price runs vertically. The line goes up — the price was rising; down — it was falling.
But in trading we usually draw candles, not a line. A candle tells you more.
One candle — four prices
Each candle shows what happened to the price over one stretch of time (for example, an hour):
- where the price was at the start of the hour (the open);
- where it was at the end (the close);
- how high it went;
- how low it went.
| Part of the candle | What it means |
|---|---|
| The thick part (body) | the distance between the open and the close |
| The thin lines above and below (wicks) | the high and the low over that time |
| Green candle | the price rose over that time |
| Red candle | the price fell over that time |
A long body — the price moved confidently in one direction. A long wick — the price went there and came back: it wasn't accepted there.
Timeframe
A timeframe is how much time fits into one candle. On the MAMAY chart there are buttons at the top: 1M, 5M, 15M, 1H, 4H, 1D — one minute, five minutes, fifteen minutes, an hour, four hours, a day.
| Timeframe | What you see |
|---|---|
| 1D (day) | the big picture over months: where the market is heading |
| 1H (hour) | the picture of the last few days |
| 5M (five minutes) | what's happening right now |
The rule: look at the higher timeframe first, then the lower one. On five-minute candles any move looks huge. On the daily chart it may turn out to be a small ripple.
Volume
Below the chart are volume bars: how much was bought and sold during each candle.
- The price rises on high volume — a lot of money is behind the move, you can trust it.
- The price rises on low volume — the move is weak and can easily reverse.
Try it yourself
- Open the "Terminal" tab.
- Click 1D — see where the price went over the last few months.
- Click 1H, then 5M — notice how the same move looks different.
↗ Open "Terminal" in MAMAY ▶ Next: long, short and orders