
Corrections and Fibonacci levels
Short version for experts: tables, lists and screenshots only.
Words in this lesson (10)
Three kinds of correction
A correction is a move against the trend. It's more complex than an impulse, and it's where people lose the most money. There are three kinds.
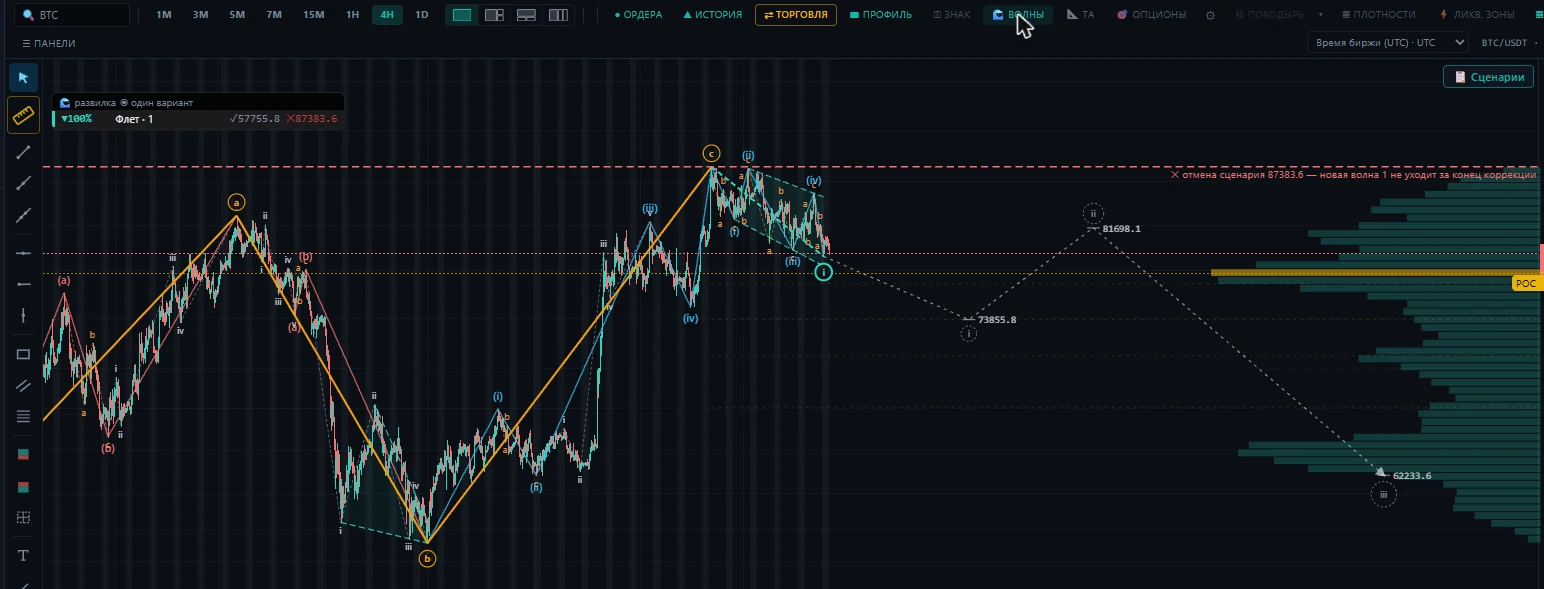
Zigzag (5-3-5) — a sharp pullback of three waves A-B-C.
- Wave B doesn't go beyond the start of wave A.
- Wave C goes beyond the end of wave A.
- Wave C is usually equal to wave A or slightly longer.
Flat correction (3-3-5) — a sideways one.
- Wave B returns to the start of wave A or goes beyond it — producing a false breakout.
- Then wave C takes the price back, often beyond the end of A.
Triangle (3-3-3-3-3) — five converging waves A-B-C-D-E.
- It occurs only in wave 4, in wave B, or as a connector — that is, before the final move.
The "irregular" correction — a favorite trap
A flat correction in which wave B made a new extreme is called expanded or "irregular". On the chart it looks like this: the price broke the high, the crowd bought the breakout — and the price dropped sharply in wave C, collecting the stops.
This is exactly the pattern the "Waves" screener in MAMAY looks for. The entry comes after wave C is complete and the line drawn through the peaks of its second and fourth subwaves is broken.
After sharp comes drawn out
A practical observation: after a sharp zigzag, expect a complex, drawn-out correction, and vice versa. If the market pulled back quickly and you're expecting an instant continuation, most likely you'll have to sit through a range.
Fibonacci levels
A Fibonacci grid shows where waves most often end. It's drawn only from the true start and end of a wave.
Where a pullback ends (as a share of the previous move):
| Wave | Typical depth |
|---|---|
| Wave 2 | 50% or 61.8% (sometimes 78.6%) |
| Wave 4 | 38.2% or 50% |
| A deep correction | 61.8% |
| A flat correction | 38.2% |
Where the target is (from the length of wave 1, projected from the end of wave 2):
| Wave | Typical target |
|---|---|
| Wave 3 | 161.8%, 200% or 261.8% |
| Wave C | 100% (equal to A), 127.2% or 161.8% |
Cluster
One level is a weak hint. A strong one is when two or three levels from different drawings land in the same place. That's a cluster. That's where you look for a reversal, waiting for confirmation: a divergence on an indicator or a reversal candle.
Confirmation by indicator
- The highest peak of the indicator (AO or MACD) is usually wave 3.
- In wave 5 the price makes a new high, but the indicator doesn't. That's a divergence: the move is running out of steam.